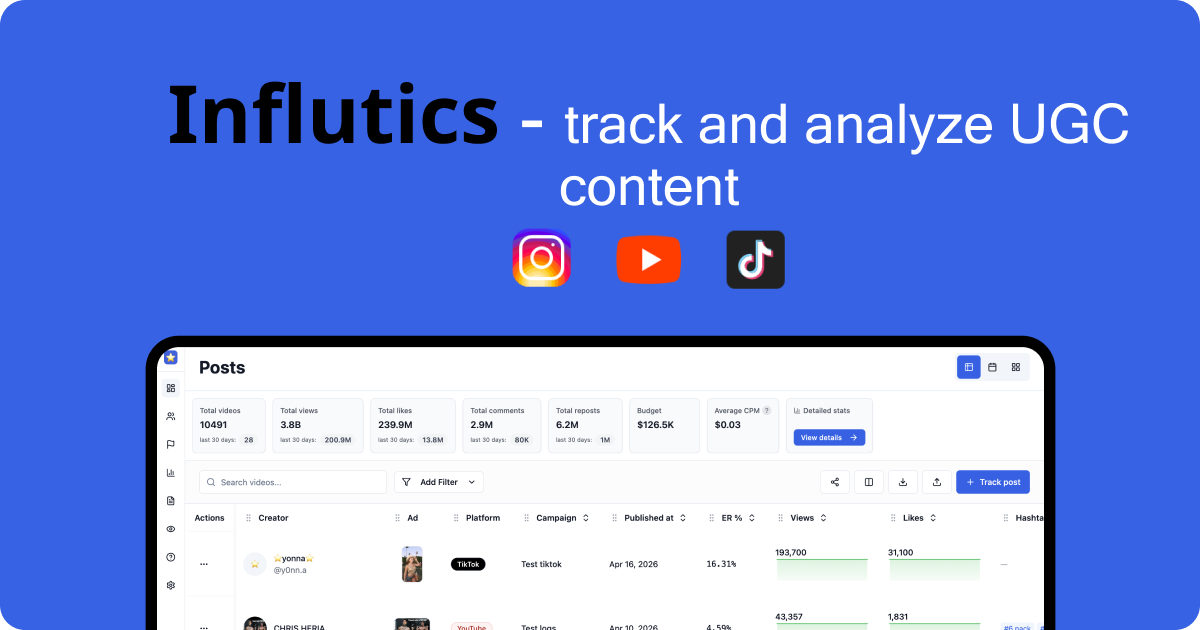
TikTok Engagement Rates: The 2026 Benchmark Guide


TikTok continues to outperform other major social platforms on engagement, and that gap changes how smart teams evaluate creator output.
For mobile app founders and agencies running UGC programs with 1,000 or more videos, tiktok engagement rates are an operating metric tied to scale. A strong rate can signal that a hook, script structure, or creator persona deserves more budget. A weak rate can show that a concept fails before paid amplification, whitelisting, or TikTok Shop expansion turn that miss into expensive media waste.
Used well, engagement data helps teams decide which creators to keep in rotation, which concepts to brief again, and which assets are strong enough to graduate from organic testing into performance campaigns. That matters more in high-volume programs, where the goal is not one viral post. The goal is building a repeatable system that produces enough winning creative to lower content production risk and improve return on spend.
Table of Contents
- Why TikTok Engagement Is the Gold Standard
- How to Calculate Your TikTok Engagement Rate
- What Is a Good TikTok Engagement Rate in 2026
- Reading Between the Lines of Your Engagement Data
- 7 Actionable Tactics to Boost Your TikTok Engagement
- How High Engagement Drives Real Business Results
- Frequently Asked Questions About TikTok Engagement
Why TikTok Engagement Is the Gold Standard
TikTok consistently posts higher engagement than other major social platforms. For marketers, that changes how you evaluate creative performance.
On TikTok, distribution follows audience response more closely than follower size alone. A creator with 30,000 followers can produce a video that outperforms a creator with 300,000 if the hook, framing, and comment response are stronger. For mobile app brands running UGC at scale, that makes engagement rate one of the fastest ways to separate creative that attracts attention from creative that merely gets posted.
Follower count still has value. It signals potential reach and can help with creator credibility. But it does not tell a growth team which creator should film the next batch of app install ads, which script angle deserves another 20 variations, or which video has enough proof of resonance to justify paid spend.
Engagement is closer to market feedback than vanity
Engagement captures active response. Likes signal low-friction approval. Comments show curiosity, objections, or intent. Shares often indicate that the content delivered enough value or relevance for viewers to pass it along. That mix gives campaign managers a better read on audience reaction than top-line reach alone.
This distinction is especially important in UGC programs. The goal is usually not brand visibility in isolation. The goal is to find repeatable creative patterns that can support installs, purchases, or qualified traffic at a cost structure the business can sustain.
Three practical implications follow:
- Creative testing gets faster: Strong engagement helps identify which hooks, product claims, creator styles, and editing patterns are worth producing again.
- Creator selection gets sharper: Teams can compare creators by response quality, not just by audience size or posted view counts.
- Paid amplification gets more disciplined: Organic engagement gives media buyers an early filter before they increase spend behind an asset.
For founders, this is a measurement question as much as a creative one. If you need to defend budget, engagement gives you an earlier signal than conversion data alone, especially when attribution is noisy or delayed.
The Operational Impact for High-Volume Teams
The value of engagement rate increases as content volume increases.
An agency or app growth team managing 1,000 or more TikTok videos cannot review every asset by instinct. They need a metric that helps rank outputs, spot outliers, and decide where the next production dollar should go. In that environment, TikTok engagement rates stop being a presentation metric and become an operating metric.
Used well, engagement data helps teams answer high-stakes questions quickly. Which creators should be rebooked. Which briefs are producing passive views instead of active response. Which concepts deserve another production cycle. Which UGC assets are strong enough to move from organic testing into whitelisting or paid social.
That is why TikTok engagement has become a practical standard for scalable UGC programs. It gives startup teams and agencies a faster way to connect creative performance to budget decisions, creator strategy, and eventual ROI.
How to Calculate Your TikTok Engagement Rate
Teams often say they track engagement. Fewer teams calculate it in a way that’s useful for performance decisions.
Two ways marketers calculate engagement
The two common methods are engagement by followers and engagement by views. The math is simple, but the strategic meaning is different.

Engagement rate by followers
Use this when you want to compare how actively a creator’s existing audience responds.
Formula:
- (Likes + Comments + Shares) / Followers × 100
Example:
- A creator has 20,000 followers
- A video gets 800 likes, 40 comments, and 20 shares
- Engagement rate by followers = (800 + 40 + 20) / 20,000 × 100
This method is easy to understand, but it can distort performance on TikTok because reach often extends well beyond followers.
Engagement rate by views
This is usually the better method for TikTok because it measures how much interaction a video generated relative to the attention it received.
Formula:
- (Likes + Comments + Shares) / Views × 100
Example:
- A video gets 800 likes, 40 comments, and 20 shares
- It receives 25,000 views
- Engagement rate by views = (800 + 40 + 20) / 25,000 × 100

Why view-based engagement matters more for UGC
For performance marketers, the stronger default is view-based engagement. JoinBrands notes that the TikTok-standard metric is engagement “by views,” with an average of 4.20% in 2025, up 9% year over year. That matters because view-based measurement exposes performance gaps that follower-based formulas can hide.
If your job is to evaluate UGC, this is the question you care about: once people saw the video, did they engage?
That framing aligns better with how TikTok distributes content. Videos are judged on how viewers react in-feed, not just how a creator’s follower base behaves. A creator can have a large following and still produce content that underperforms once it reaches cold viewers. Another creator can have a smaller profile but consistently turn views into comments and shares.
Use follower-based ER when you’re screening creator community quality. Use view-based ER when you’re deciding which videos deserve more production volume or paid support.
A solid workflow for campaign managers looks like this:
- Screen creators initially by visible consistency.
- Calculate engagement by views for each shortlisted video.
- Compare the top-performing content angles, not only the top-performing creators.
- Separate one-off spikes from repeatable formats.
That last point matters most. A single breakout video can mislead a team. Repeated strong view-based engagement across multiple videos is more useful because it suggests the creator understands how to package a message, not just how to catch a lucky trend.
What Is a Good TikTok Engagement Rate in 2026
The useful benchmark is not a single platform-wide average. For teams buying and producing TikTok UGC at scale, the right question is narrower: what engagement rate is strong for this creator tier, in this category, across enough videos to justify more budget?
A campaign manager handling 1,000 or more app videos cannot grade every asset against one blended number. That approach hides the creators and concepts that can scale profitably. It also inflates the perceived value of large accounts whose audience size looks efficient on paper but whose content draws weaker interaction relative to reach.
Benchmarks by creator size
Creator size still shapes engagement expectations. Earlier benchmark data in this guide showed a consistent pattern. Smaller creators tend to deliver higher engagement rates than larger accounts, partly because their content often feels more native to the feed and less like conventional brand creative.
Here is the practical benchmark table to use when screening creators by follower band.
| Creator Tier | Follower Count | Median Engagement Rate |
|---|---|---|
| Nano | 1K to 10K | 7.84% |
| Macro | 100K to 500K | 2.73% |
| Mega | 500K+ | 1.84% |
The spread matters. A 3% engagement rate can be weak for a nano creator and solid for a macro creator. Founders who ignore that difference often over-index on account size, then discover that higher fees did not produce stronger creative output or better paid amplification candidates.
For UGC programs, this changes how you allocate testing volume. Nano creators are usually the best source of raw creative signal. Macro creators are more useful after you already know which hooks, scripts, and visual patterns convert attention into action.
Benchmarks by niche and campaign type
Category context changes the threshold again. The Keyword reports that professional services often sit in the 3% to 5% range, while emotional categories can reach 9%. That gap is large enough to distort reporting if your team compares every creator against one master KPI.
For app marketers, this is more than a reporting detail. Utility-driven products such as fintech, productivity, or B2B SaaS often generate fewer lightweight interactions because the viewer decision is more rational and less identity-driven. Lifestyle, wellness, beauty, and emotionally charged consumer offers usually have a higher engagement ceiling because viewers are quicker to comment, share, or signal affinity in public.
A better operating model is to score performance across three cuts:
- Creator tier, because a 2% result means different things at 10K followers and 500K followers
- Content angle, because a product demo, founder story, and problem-solution hook produce different interaction patterns
- Offer category, because app install creative behaves differently from fashion, entertainment, or community-led products
A good engagement rate is one that beats the relevant benchmark for that creator’s size and your category, then repeats across enough videos to support more production.
That last condition matters for high-volume UGC teams. One strong post is interesting. Ten videos from different creators using the same angle, all landing above the expected range for their tier, is operationally useful. That is the point where engagement stops being a vanity metric and starts acting like a scaling signal.
For agencies and mobile app founders, the practical takeaway is simple. Set benchmark bands before launch, review results by cohort rather than in aggregate, and shift spend toward creator-angle combinations that outperform their own peer group. That process gives you a clearer path to scale than chasing the highest visible engagement number in the roster.
Reading Between the Lines of Your Engagement Data
A 5% engagement rate can mean two very different things. One video may be collecting low-friction likes from casual viewers. Another may be generating shares, saves, and comments that signal actual purchase intent or creative repeatability.
That distinction matters more for teams running UGC at scale. If you manage hundreds or thousands of videos, surface engagement rate is only the first filter. The primary task is identifying which assets are likely to produce more winners when you brief the next 50 creators.
Interaction mix matters more than headline rate
Every engagement action reflects a different level of intent.
Likes usually measure lightweight approval. Comments can signal interest, confusion, objection, or community behavior. Shares and saves often indicate that the viewer found the content useful, surprising, or worth revisiting. If you collapse all of those actions into a single number, you lose the pattern that helps explain performance.

For campaign analysis, a weighted formula is often more useful than a flat one:
- (Likes×1 + Comments×5 + Shares×7 + Saves×10) / Views
Use that as an operating model, not as a universal platform standard. The point is prioritization. A video with average likes and unusually strong saves may deserve more budget than a video with a higher headline engagement rate built mostly on passive reactions.
Read for intent, then for scale potential
The strongest signal is usually not total interaction volume. It is the composition of that volume.
A few common patterns show up repeatedly in large creator programs:
- High likes, weak comments, weak shares: The creative was watchable, but it likely did not create enough conviction to drive advocacy or discussion.
- Average likes, strong comments: The hook or claim created involvement. Review comment quality before scaling. Curiosity and product questions are useful. Confusion is not.
- Strong shares or saves: The asset probably delivered a clear payoff, such as a useful tip, memorable framing, or a strong social signal.
- High comments with polarized sentiment: The video may be good at attracting attention but poor at building trust. For app brands, that often hurts conversion quality.
This is why top UGC does not always look like the obvious winner in a basic dashboard.
For mobile app founders and agencies, the practical implication is clear. A video that drives saves around a feature explanation or shares around a problem-solution setup is often more scalable than a trend-based post that earns a spike of likes and then dies. One creates a repeatable creative brief. The other creates noise.
A better review process for large UGC libraries
High-volume teams need a system that separates attractive metrics from useful ones.
Start with the standard view-based engagement rate. Then review what made up that rate. After that, inspect the comments themselves, not just the count. Finally, compare the asset against adjacent videos from the same creator, same hook family, or same offer.
A simple operating workflow looks like this:
- Sort videos by view-based engagement rate
- Break out likes, comments, shares, and saves
- Check comment quality for intent signals such as product questions, objections, or creator trust
- Tag the video by hook, format, offer angle, and creator type
- Promote patterns that repeat across multiple creators, not isolated outliers
That last step is where teams usually lose money. They identify top posts, but they do not identify which variable produced the result. In a library of 1,000+ videos, the goal is not to celebrate the winner. It is to find the creative pattern you can reproduce across the next batch and defend in a performance review.
7 Actionable Tactics to Boost Your TikTok Engagement
Most engagement gains come from better creative operations, not from chasing random platform tricks.

Creative changes that improve response
- Open with a pattern break
The first seconds need a reason to stop scrolling. Use a direct claim, an unexpected visual, a mistake, or a strong before-and-after setup. UGC usually performs better when it starts inside the action rather than with an introduction. - Write for comments, not just views
Good TikTok creative leaves a small gap for the audience to fill. Ask a pointed question, present a choice, or make a debatable claim. Comment-friendly framing often produces stronger interaction than fully polished brand messaging. - Use human-face framing early
If the creator appears quickly and speaks directly, the content tends to feel more native. That’s especially important in app promotion, where viewers need to trust the recommendation before they care about the product. - Build around a single payoff
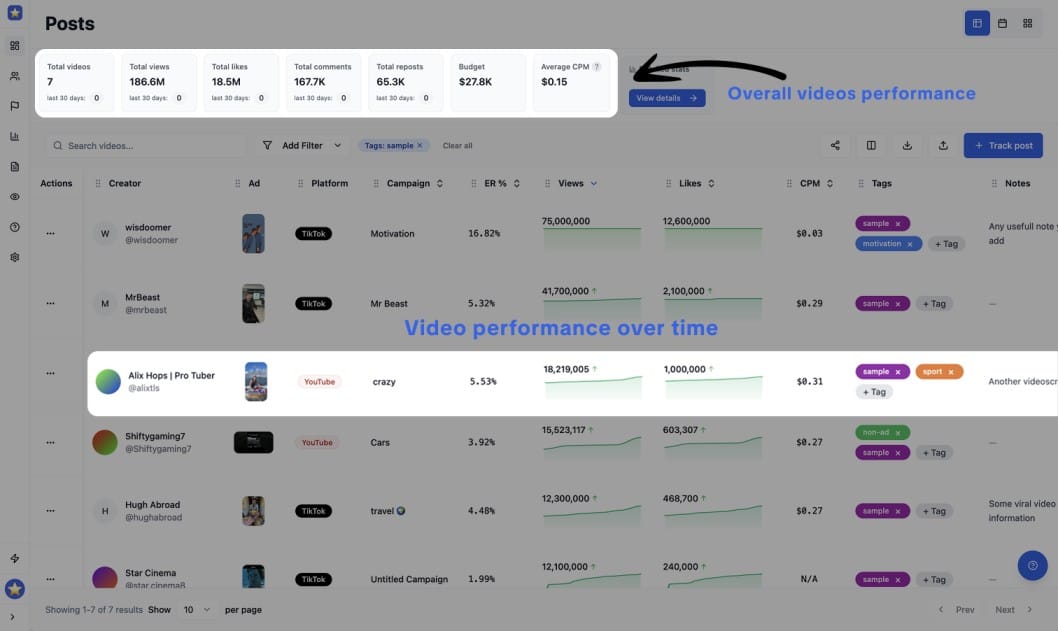
Videos underperform when they try to do too much. One message per asset works better for engagement analysis because you can tell exactly what the audience responded to. - Track all your content
Without systematic tracking of all your produced content it is unlikely you can scale the results, you need to measure each video performance overa time -> understand what works for you brand. My personal suggestion: use tools like influtics.com
A useful training resource for teams refining their approach is this short video breakdown:
Operational habits that compound results
- Reply to comments while the post is still active
Comment replies can extend the life of a video and deepen the feedback loop. They also give you direct language from users, which helps improve future briefs. - Test creators in clusters, not one at a time
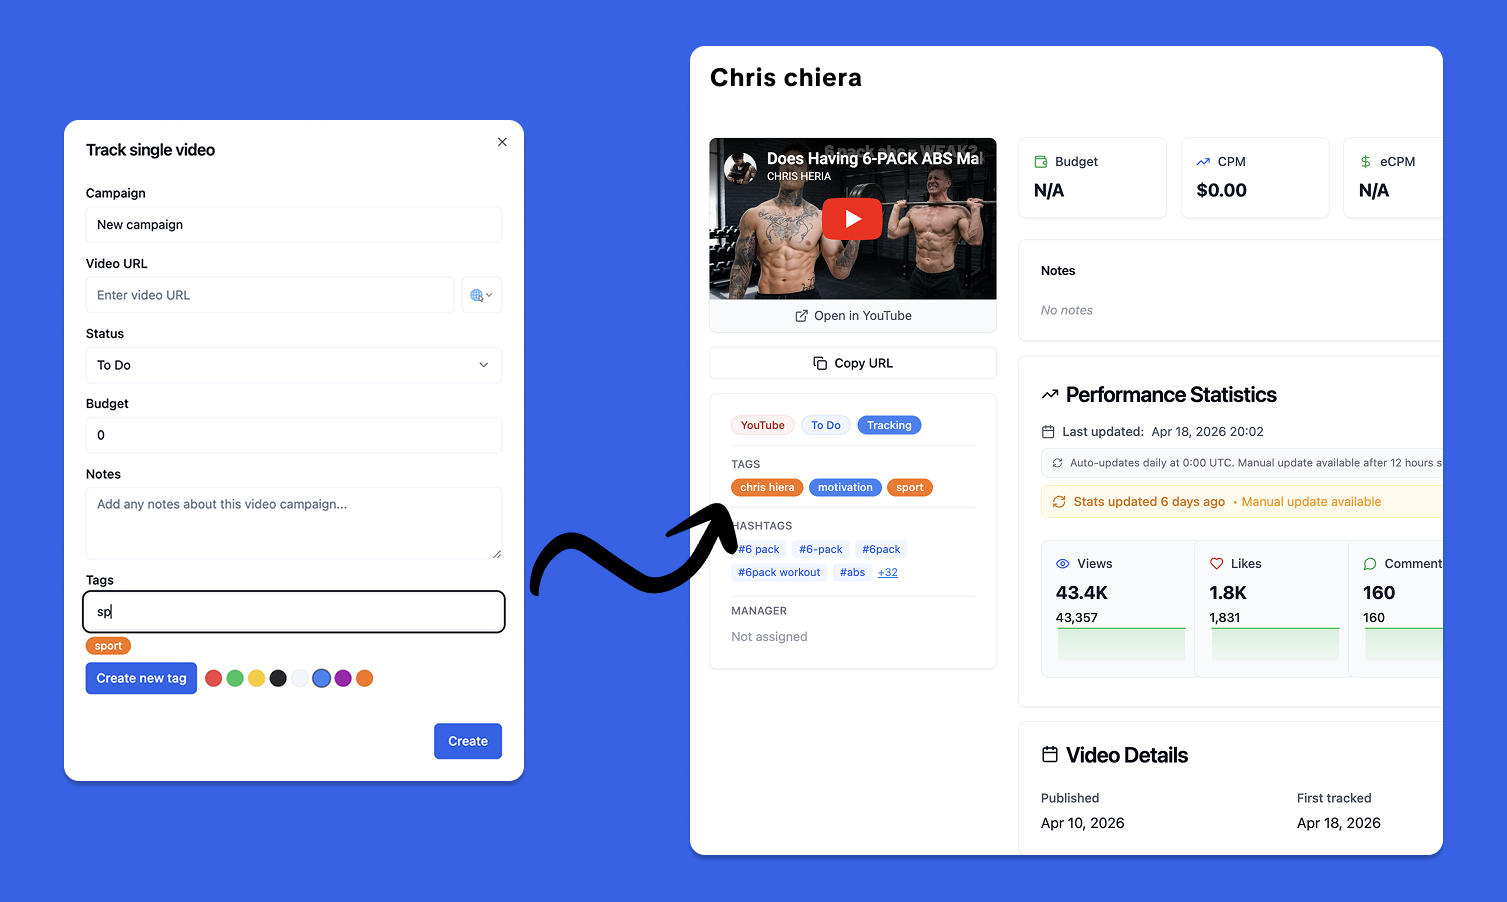
A single creator can fail for reasons unrelated to the concept. Run the same brief across multiple creators, then compare which angle wins repeatedly. This reduces the chance that you mistake creator style for content-market fit. - Tag and archive winning patterns systematically
Without codifying what worked, engagement gains are frequently lost. Label videos by hook type, visual setup, CTA style, topic angle, and creator persona. Then build new briefs from the best combinations.
A simple operating checklist helps:
- Track hooks: Save the first spoken line and first on-screen text.
- Track objections: Note whether the video answers skepticism directly.
- Track interaction shape: Record whether comments, shares, or saves led the response.
- Track reuse potential: Mark assets that could work in paid, organic, or creator whitelisting contexts.
If you manage a high volume of UGC, consistency in creative tagging is often more valuable than publishing more videos without a learning loop.
The strongest teams don’t rely on instinct alone. They build a repeatable system for observing what earns reaction, then feed those insights back into the next creator brief.
How High Engagement Drives Real Business Results
High engagement changes the economics of a TikTok campaign. It gives teams a faster way to identify which videos deserve more budget, which creator angles merit another round, and which assets can move from organic testing into paid acquisition.
Why strong engagement produces stronger business signals
For mobile app founders and agencies running UGC at scale, engagement is useful because it shows more than surface-level attention. A video with active comments, shares, saves, or strong watch behavior often signals that the message was clear, relevant, and persuasive enough to trigger a response.
That matters because scalable UGC campaigns rarely fail from lack of volume. They fail when teams produce hundreds of videos without a reliable way to separate creative noise from creative signal.
Smaller or more niche creators often help here, not because they always outperform larger accounts, but because their content can feel closer to real product usage. In app marketing, that usually leads to more credible demonstrations, sharper audience fit, and comments that reveal why viewers are interested or hesitant. Those signals are more useful than a view count alone when you need to decide what to scale across 1,000 or more videos.

How to turn engagement into a buying decision
High engagement works best as a decision input, not a trophy metric. A campaign manager should use it to answer four practical questions:
- Did the message connect fast enough to stop scrolling
- Did the creator present the product in a credible way
- Did the response pattern suggest curiosity, trust, or buying intent
- Did this asset earn a second life in paid social, Spark Ads, or creator whitelisting
The interaction mix matters. Shares and saves often indicate that the content has reuse value to the viewer. Comments can expose objections, use cases, and demand language that product and growth teams can fold back into the next brief. A high like count with weak comments may still be useful, but it is usually a weaker business signal than a post that starts conversation.
The strongest operators read engagement by campaign stage. Early on, it helps identify message-market fit and creator-message alignment. Later, it helps rank which concepts should get incremental spend, refreshed variants, or broader creator distribution. That is the shift from reporting performance to using performance data to improve ROI.
Strong engagement does not guarantee revenue. It increases the odds that you are scaling content the market already showed interest in.
That distinction is what separates vanity reporting from a usable growth model. Teams managing large UGC pipelines get more from engagement data when they tie it to downstream outcomes such as click-through rate, install rate, cost per acquisition, or trial start rate. If a specific hook repeatedly generates strong engagement and efficient installs across multiple creators, that is not just a creative win. It is a repeatable acquisition input.
Frequently Asked Questions About TikTok Engagement
Does deleting a poor-performing TikTok help my account
Usually, it’s better to learn from the post than to erase it reflexively. A weak video can still show you whether the problem was the hook, the topic, the creator fit, or the CTA. If the content is off-brand or misleading, removal makes sense. Otherwise, keep the data.
Is a sudden drop in engagement always a bad sign
No. A drop can mean your content reached a broader, colder audience. It can also mean the format changed, the creator shifted style, or the topic had less natural discussion value. Check the interaction mix before you assume the account is declining.
For brand deals, is engagement rate more important than follower count
For most UGC campaigns, yes. Follower count tells you how large a creator appears. Engagement helps you judge whether viewers care. The strongest creator choice depends on your goal, but if you need content that resonates and can be repurposed, engagement is usually the more useful decision metric.
Should I compare every creator to one platform average
No. Compare creators against their size tier, niche, and content type. A single blended benchmark hides too much context and can push you toward the wrong creators.
What’s the best way to use engagement data at scale
Don’t stop at a leaderboard. Group content by hook, creator type, topic, and interaction pattern. Then use those patterns to improve the next round of briefs.
If you're running creator programs across TikTok, Instagram, and YouTube, Influtics helps you manage large-scale UGC campaigns, analyze creator profiles through its Chrome extension, track performance across 1,000+ videos, and connect engagement data to ROI decisions that founders and agency teams can use.