Instagram Reels Analytics: The Ultimate Guide for 2026


Some teams think they have instagram reels analytics under control because they can see views, likes, and reach inside the app. They don’t. They have a partial dashboard for individual posts, not an operating system for a creator program.
That gap matters more now because Reels aren’t a side format anymore. In 2025, Reels accounted for 38.5% of all content in the Instagram feed and 46% of total time spent on the platform, and they delivered a 37.87% higher reach rate than other formats, with average engagement at 1.23% according to Contra’s 2025 Reels data. If you manage UGC for an app, a D2C brand, or an agency roster, that means poor analytics discipline doesn’t just blur reporting. It changes which creators you keep, which hooks you repeat, and which videos you scale with budget.
The practical problem is simple. Native insights show enough to make you feel informed, but not enough to make sharp decisions across hundreds or thousands of videos. Likes look good in screenshots. Views look impressive in client decks. Neither tells you, by itself, why one creator consistently drives installs while another produces empty reach.
Table of Contents
- Why Your Instagram Reels Analytics Are Lying to You
- Finding Your Way Around Instagram's Native Analytics
- The Metrics That Predict Virality and ROI
- How to Collect and Validate Analytics at Scale
- Interpreting Analytics for App Growth and UGC Campaigns
- Setting Benchmarks and Reporting for Creator Programs
- From Data to Decisions The Future of UGC Performance
Why Your Instagram Reels Analytics Are Lying to You
High view counts are one of the easiest ways to misread Reel performance.
Many marketing teams still evaluate Reels the way they evaluate standard social posts. They sort by views, scan likes, and assume the top post found the winning creative. That shortcut breaks fast in UGC programs. When you are reviewing hundreds or thousands of creator videos, a Reel with broad distribution can still be the wrong asset to scale, whitelist, or turn into a new brief.
The problem is not bad data. The problem is shallow interpretation inside a system that was built for post-level review, not program-level decision making.
A Reel can rack up views because the hook created curiosity, then lose attention before the product claim, demo, or offer appears. It can collect likes from existing followers and still fail to earn saves, shares, profile visits, or any signal that the content changed intent. In a scaled creator program, those false positives waste budget. Teams brief more creators on the wrong concept, keep weak formats in rotation, and overpay for creators who generated reach without business impact.
Reach without retention is a trap
Reels do get distribution. That is why they sit at the center of serious creator programs. The mistake is treating distribution as proof that the creative worked.
Instagram’s native view of performance rarely shows whether a strong result came from a repeatable pattern or a one-off spike tied to timing, audience overlap, or an unusually strong opening second. For a brand running UGC at volume, that distinction decides where the next tranche of spend goes.
These are operational decisions, not content-theory debates:
- Scale a creator because their hooks hold attention across multiple posts
- Reuse a script angle because different creators can make it work
- Cut a format because it attracts cheap reach and weak post-view behavior
Practical rule: If a Reel looks strong only on top-line views, treat it as incomplete evidence.
Vanity metrics distort creator decisions
Likes are easy to track and easy to overvalue. They mainly show that a viewer had a positive enough reaction to tap once. That does not tell you whether the message was understood, whether the value proposition landed, or whether the content created enough interest to drive a later action.
For large creator programs, instagram reels analytics should answer questions tied to budget, briefing, and creative replication.
| Question | Weak metric | Better evidence |
|---|---|---|
| Should we brief more creators on this concept? | Likes | Saves, shares, watch behavior |
| Did the hook work? | Views | Early retention, drop-off pattern |
| Did this creator fit the message? | Reach | Repeatable post-level performance across multiple videos |
That is the gap native analytics leaves open. Instagram is good at showing what happened on a single post. It is much worse at helping a team compare patterns across a large creator set, validate whether a result is repeatable, and connect creative performance to ROI. That is where advanced interpretation, and usually third-party reporting infrastructure, becomes necessary.
Finding Your Way Around Instagram's Native Analytics
Instagram Insights gives you post-level visibility. For a single creator or a small account, that can be enough. For a UGC program running hundreds or thousands of Reels, it breaks down fast.
If you open a Reel from a Professional account, Instagram will show the familiar fields: views or plays, reach, likes, comments, shares, and saves. Those numbers are useful as raw inputs. The problem is that native analytics were built for reviewing one post inside one account, not for comparing creative patterns across a large creator roster.

What each native metric is telling you
Use the in-app dashboard as a glossary first:
- Reach shows how many accounts saw the Reel.
- Views or plays show how many times it was watched.
- Likes show low-friction approval.
- Comments can indicate interest, but they also reflect audience behavior and creator community strength.
- Shares point to distribution value. People considered it worth sending to someone else.
- Saves usually signal utility, reference value, or intent to come back later.
That framing matters because native metrics are easy to misread in isolation. A Reel with strong reach and weak saves often got distribution without creating much residue. A Reel with modest reach and strong shares may deserve a second look, especially if multiple creators produced the same pattern.
Where native analytics starts to fail operationally
The first gap is comparison. Instagram lets you inspect one Reel at a time inside one creator account. That is manageable when reviewing a handful of posts. It is slow and error-prone when a team needs to compare fifty creators testing the same hook, CTA, or product angle.
The second gap is structure. Reels do not fit neatly into the same reporting model as standard posts. They use different fields and different behavior signals, including replay and watch-related data. Teams that dump everything into one spreadsheet without normalizing those fields usually end up with bad comparisons, weak reporting, and false winners.
I see this problem often in scaled creator programs. Native screenshots arrive at different times, with different date ranges, from accounts with different audience baselines. By the time someone assembles the numbers, the team still cannot answer the core question: which creative pattern should get more budget?
Native insights help with inspection. They do not give campaign operators a clean system for validation, comparison, or ROI reporting across a large creator set.
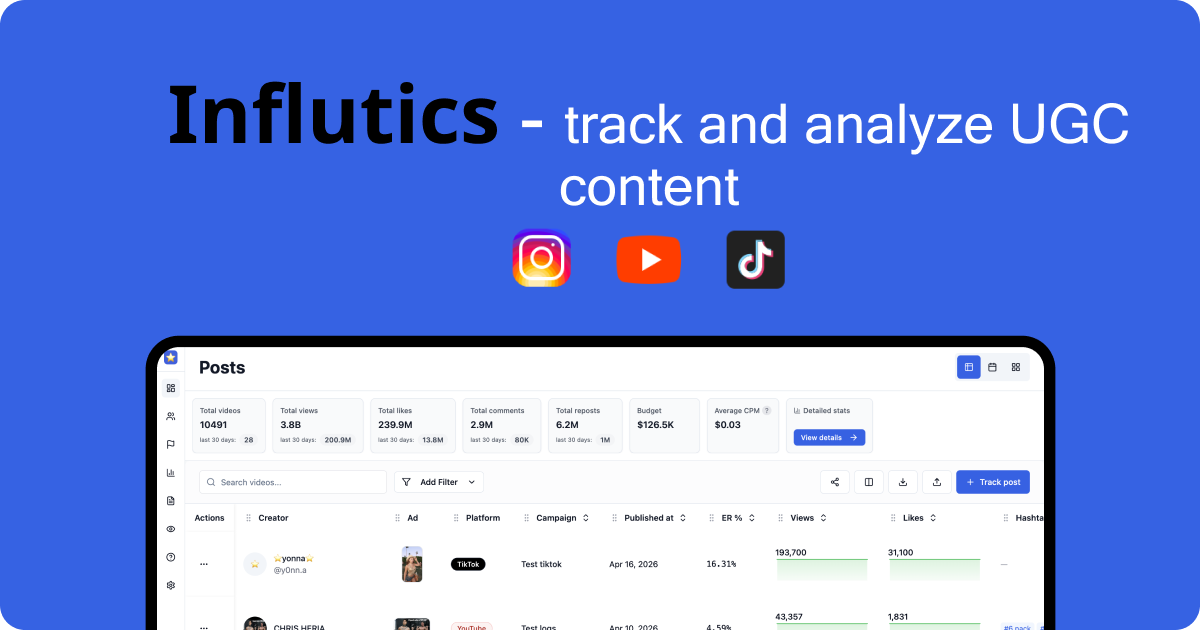
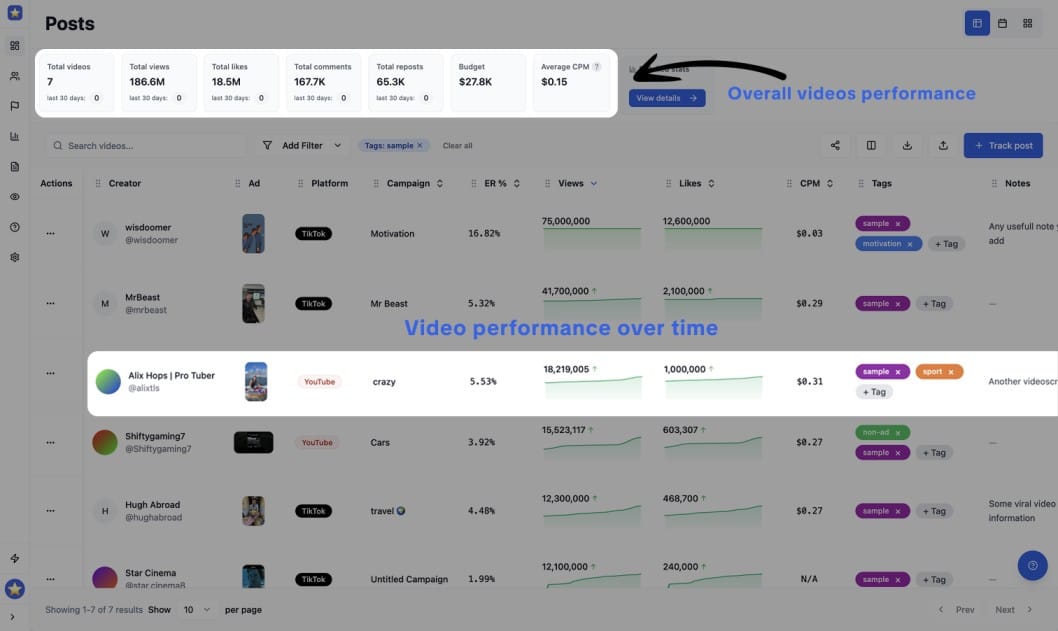
The better way to track overall UGC performance is to use tools like influtics
What native insights are good for
Instagram's own dashboard still has a role. Use it for narrow tasks where account-level context matters:
- Spot-check a single Reel when performance spikes, stalls, or drops.
- Verify creator-reported numbers when screenshots and exports do not match.
- Train team members on metric definitions so everyone reads the same fields the same way.
That is useful groundwork. It is not a reporting system for a scaled UGC engine, and it will not solve attribution, cross-creator benchmarking, or creative repeatability on its own.
The Metrics That Predict Virality and ROI
Scaled Reels programs win on attention quality and downstream intent, not raw reach.

Views still matter. They tell you a Reel earned initial distribution. But views alone are weak buying criteria when a team needs to decide which creators, hooks, and edits deserve more budget across hundreds or thousands of videos.
For large UGC programs, the better question is simple: did the video hold attention long enough, create enough intent, and lead to a measurable next step? That is where native Instagram reporting starts to fall short. It shows top-line performance, but it does not give operators a clean way to compare creative quality against business outcomes across a big creator set.
Sociality’s 2025 Instagram analytics overview points to the same shift. Views are the baseline. Watch time, replays, shares, and saves are stronger signals for discoverability and growth.
Views are a screening metric
A high view count can come from several different conditions. The opening hook may have worked. The account may have received a temporary distribution lift. Existing followers may have watched more than once. Paid support, posting time, and creator audience quality can distort the number too.
That is why I use views to filter, not to rank. Once a Reel clears a minimum distribution threshold, the review should move to the signals that tell you whether the content earned more attention and generated intent.
The metrics worth tracking across a creator program
For scaled UGC analysis, this is the stack that tends to predict whether a Reel can travel and whether it can produce commercial value:
- Watch time
Watch time shows whether the edit, pacing, and message held attention. In creator testing, this is often the fastest way to separate a strong concept from a strong audience. - Replays
Replays usually indicate curiosity, density of information, or entertainment strong enough to warrant a second look. That matters because repeat viewing often signals deeper interest than a like. - Shares
Shares are distribution fuel. A shared Reel reaches beyond the creator’s own audience and usually reflects relevance strong enough for someone to attach their name to it. - Saves
Saves are one of the best signals for utility and future intent. Recipes, tutorials, product demos, before-and-after formats, and comparison videos often perform well here because viewers want to return later. - Retention-to-conversion flow
Sociality highlights R2C flow, or retention-to-conversion, as a useful lens for connecting viewing behavior to outcomes like profile visits and growth. That framing matters for app growth and performance teams because a Reel can produce strong return without posting the highest view count in the batch.
The pattern is consistent. Vanity metrics reward surface reaction. Intent metrics show whether the content created enough interest to travel, stick, or convert.
| Metric | What it often reflects | Why it matters |
|---|---|---|
| Views | Initial distribution | Useful for first-pass screening |
| Likes | Surface approval | Weak predictor on its own |
| Shares | Relevance and pass-along value | Strong signal for broader reach |
| Saves | Utility and future intent | Strong signal for long-tail value |
| Watch time and replays | Attention quality | Strong signal for creative strength |
A quick explainer helps before the next layer of analysis:
One trade-off matters here. The Reel with the biggest view count is often the easiest one to defend in a meeting. It is also often the wrong one to scale.
If one creator posts a Reel with big reach but weak saves, weak watch behavior, and no meaningful follow-through, that video probably benefited from distribution more than creative strength. Another creator may deliver lower reach but stronger retention, more shares, more saves, and better post-view action. In a scaled UGC program, that second creator is usually the safer investment because the pattern is more repeatable.
That is the difference between content that looks successful in Instagram and content that holds up under ROI review.
How to Collect and Validate Analytics at Scale
Scale breaks the reporting process before it breaks the analysis.

Once a UGC program reaches dozens of creators, and especially once it reaches hundreds or thousands of Reels, the main problem is no longer finding metrics. The problem is collecting the same metrics, at the same time window, in the same format, with enough confidence to compare creators fairly.
Instagram’s native insights are still useful here. They work well for spot checks, creative reviews, and one-off investigations when a specific Reel looks suspiciously strong or weak. They do not give operations teams a clean system for campaign-level reporting across large creator pools.
That gap matters. In scaled programs, bad collection creates bad decisions. A creator can look like a top performer because they reported late, captured a better attribution window, or sent incomplete numbers that nobody normalized before the weekly report went out.
Native insights are fine for spot checks
The in-app workflow is simple. Open the Reel, tap Insights, and read the numbers.
That approach holds up for a founder reviewing their own content or a small team checking a limited batch of posts. It starts to fail when multiple creators submit performance from different accounts, regions, posting dates, and reporting windows. Reels also do not map cleanly to the same reporting logic as feed posts, so teams that force everything into one spreadsheet usually end up with distorted rollups.
As noted earlier, Reels metrics diverge from standard post reporting. If the ops layer ignores that, the analysis is compromised before anyone starts interpreting performance.
Manual reporting breaks under volume
The next stage is familiar. Creators send screenshots. Account managers copy numbers into sheets. Analysts clean naming conventions, fix dates, chase missing URLs, and try to guess whether a screenshot was captured after 24 hours or after 9 days.
Every agency has run this process at some point. Few want to keep it.
Manual collection creates recurring failure points:
- Mismatched reporting windows that make creator comparisons unreliable
- Inconsistent metric naming across screenshots, exports, and spreadsheets
- Missing post identifiers such as Reel URLs or exact publish dates
- Audit problems because screenshots are slow to verify in bulk
- Reporting lag that delays budget shifts and creative decisions
Manual review still helps with creative QA and exception handling. It is a weak operating system for campaign analytics.
Automated collection gives you a usable dataset
Scaled creator programs need centralized collection because standardized inputs are the only way to compare outputs. Convenience is a side benefit. The primary benefit of automation is confidence that the dataset is structured well enough to support budget decisions, whitelisting decisions, and creator tiering.
A practical stack usually looks like this:
| Method | Good for | Main weakness |
|---|---|---|
| Native insights | Quick review of single posts | No campaign-level view |
| Manual screenshots and sheets | Lightweight proof from creators | Error-prone and slow |
| Automated platform | Centralized tracking and comparison | Needs setup and workflow discipline |
Some teams build internal reporting pipelines. Others use creator analytics platforms that aggregate performance across accounts and campaigns. Tools like Influtics fit that layer. It provides campaign management, UGC tracking, creator analytics, and performance measurement for large-scale video programs, which helps teams compare creators, concepts, and content clusters without chasing screenshots across Slack, email, and creator DMs.

Validation still needs human rules
Automation does not solve data quality on its own. It solves collection. Validation still needs process.
A reliable QA framework usually includes a few checks:
- Confirm the Reel URL matches the reported post
- Verify the publish date and capture date
- Standardize the reporting window across all creators
- Compare creator-submitted numbers against centralized pulls when available
- Flag large outliers for manual review
- Separate organic creator posts from paid amplification or boosted content
The best setup is usually hybrid. Automation handles ingestion and normalization. Humans review anomalies, catch edge cases, and interpret why a pattern is happening.
That distinction matters in large UGC programs. Instagram gives you post-level visibility. ROI measurement at scale requires an operations layer on top of it.
Interpreting Analytics for App Growth and UGC Campaigns
A dashboard becomes useful only when it changes your next brief.
For app growth campaigns, the most practical way to read instagram reels analytics is to look at the Reel as a sequence. Hook. Hold. Value delivery. CTA. Drop-off tells you where that sequence failed.

What a bad retention curve usually means
Metricool’s Reels analytics guidance points to a critical pattern: a sharp drop in the first 3 seconds usually signals a weak hook, and skip rates above 40% often lead to 50-70% reduced reach. It also notes that Reels with more than 70% completion drive 2x profile visits and 1.5x follower growth, as covered in Metricool’s breakdown of Instagram Reel analytics.
In practice, that means a retention chart is more than a content diagnostic. It’s an editing diagnostic.
If a Reel dies immediately, the usual reasons are familiar:
- The opening frame is vague and the viewer can’t tell what they’re about to get
- The creator starts too slowly with setup instead of tension
- The benefit appears too late for a cold audience
- The on-screen text and spoken hook don’t align
A lot of UGC loses the audience before the product proof appears. Teams then blame the creator, when the actual problem was briefing and structure.
How strong Reels earn a second look
Now take the opposite case. A Reel holds attention cleanly through the opening, people complete it at a healthy rate, and the post collects saves or shares. That usually tells you the concept has legs beyond one creator.
Here’s how I’d translate common patterns into actions:
- High drop-off at the opening
Rewrite the first line. Cut intro language. Show the result earlier. - Stable retention through the middle, weak finish
The body works. The CTA or ending likely needs a clearer payoff. - Strong completion with weak saves
Entertaining, but maybe not useful enough. Add a more practical angle. - Strong saves or shares with moderate views
Keep testing. That Reel may be commercially stronger than it looks at first glance.
A good Reel doesn’t just hold attention. It earns a reason to come back, share, or act.
For app campaigns, this interpretation matters because not every winning ad looks dramatic in social reporting. Some of the best performers are quiet. They explain the pain clearly, show the app solving it, and maintain enough retention to keep distribution healthy. Those are often the videos worth templating across more creators.
Setting Benchmarks and Reporting for Creator Programs
At some point you need to stop debating whether a Reel is “good” and define what good means.
The most useful benchmarks here aren’t generic vanity metrics. They’re the signals that tell you whether a piece of content deserves to be repeated across the program. Stay Abundant’s 2025 analytics guidance identifies Save-to-Reach Ratio above 2% and Engagement Rate by Reach of 4-6% as standout indicators of long-term value, and notes that content hitting those thresholds can be prioritized 3-5x more by the algorithm. It also says a view-to-follower ratio above 5% on top-performing content predicts 20% month-over-month follower growth, based on Stay Abundant’s Reels analytics benchmarks.
The metrics worth putting in every report
For creator programs, I’d keep the scorecard tight:
| Metric | What to do with it |
|---|---|
| Save-to-Reach Ratio | Use it to identify evergreen concepts worth re-briefing |
| Engagement Rate by Reach | Use it to compare creators fairly across different audience sizes |
| View-to-Follower Ratio | Use it to spot content breaking beyond the creator’s base |
These metrics help with hard decisions. Which creators stay in the roster. Which scripts get re-shot. Which concepts should move from organic test to broader rollout.
A reporting structure clients can actually use
Most client reporting is too bloated. It dumps metrics without judgment.
A stronger monthly creator report usually has three parts:
- Performance summary
Which Reels crossed your benchmark thresholds and which missed them. - Creative pattern review
Which hooks, offers, and formats appeared repeatedly among top performers. - Action list
What gets scaled, what gets revised, and what gets removed from the next sprint.
If a report doesn’t end with resource allocation decisions, it isn’t really reporting. It’s archiving.
You also need categories. Don’t rank only by creator. Rank by hook type, content angle, video structure, and CTA style. That’s how you avoid the common mistake of assuming “creator A is better than creator B” when the actual answer is “creator A received a better concept.”
From Data to Decisions The Future of UGC Performance
The teams getting real value from instagram reels analytics aren’t the ones collecting the most screenshots. They’re the ones turning creative performance into operating rules.
That means they know which metrics are surface-level and which ones signal quality. They understand that native insights are useful but incomplete. They collect data in a way that survives scale. And they read Reels as sequences, not just posts, so they can fix the exact part of the video where attention breaks.
The shift is bigger than reporting. It changes how you brief creators, how you review edits, and how you decide what earns more volume. That’s the difference between running UGC as content production and running it as a growth channel.
For app founders and agencies, the future of UGC performance is less about finding a single viral video and more about building a repeatable system. Better hooks. Cleaner retention. More reliable creator comparisons. Tighter links between social behavior and conversion outcomes.
When that system is in place, analytics stop being a post-campaign ritual. They become part of the production loop.
Ready to move beyond spreadsheets and screenshots? A dedicated workflow makes it easier to track and analyze all your UGC content, see which creators and content formats are outperforming, and measure real campaign ROI across Instagram and other creator channels. If you want that in one place, take a look at Influtics.